Learn the Basics:
Game Results
US Forecasts
Pick34 Bible
Your Personal Forecasts
|
|
Game Results
Work with Numbers
Pick34 Bible
|
|
Tool Access Subscription
Special Users Group
Help and Support
|
|
|
|
Welcome to
Pick34.com Software and Services
The Favorite Web Site for Number Crunchers in North America.
|
|
|
Does your State lottery prefer Doubles over Singles?
Read the Expectations Chart to find out!
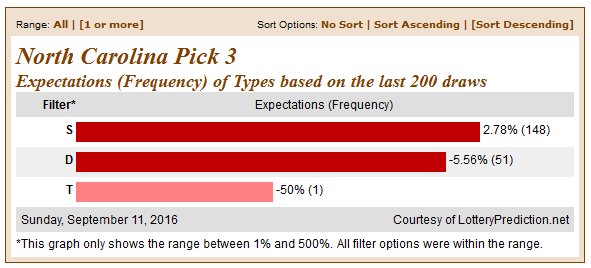
 The 1000 Pick 3 numbers consist of 720 singles (72%), 270 doubles (27%) and 10 triplets (1%). The percentages can be used to see how they compare to the actual situation in your favorite lottery.For example within the most recent 200 draws of any lottery the expectation would be to have about 144 singles, 54 doubles (27%) and 2 triplets (1%). You can compare these numbers with the actual ones to see how accurate they are in your state lottery. This is exactly what the Expectation charts do for you.Reading the chart is easy . The percentages in the graph show you how different the actual data is compared to the expected data. If the percentage is higher the actual results are higher than expected, when it is lower the results are lower than expected.Here an example from North Carolina Pick 3 You can see that there are more Singles (S) than expected (2.78% more) and there are less Doubles (D) (5.56% less). In addition you see that only 1 Triple occurred during the most recent 200 draws which is 50% less than the expected 2 Triples for that period. For your upcoming selections that tells you to keep doubles and triples in mind as there might still be more to come.Expectations charts are available for many other filters too. To see the selection check out the charts here:Pick 3Pick 4The Pick34 Tools subscription is required to access the charts:Click here to sign up!GOOD LUCK! |
| | Visit the 34 FREE Zone!
Click on the link above for a complete directory of FREE options!
|
| | Access the Subscriber Area!
Click on the link above for a complete directory of Subscription options!
|
|
|
| |